MLB Power Rankings: How Close Have Teams Performed to Their Preseason Projections?
It’s Friday, which means it’s time for SI’s MLB Power Rankings. With Emma on vacation, I’m filling in this week and taking a look back at how the 2019 season was supposed to play out. In this case, I’ve highlighted 10 teams who have either significantly over- or underperformed their FanGraphs preseason projections or, perhaps more surprisingly, landed right on them. Let’s get to it.
30. Tigers (38–87; Last Week: 30)
Revisiting FanGraphs’ projections, the biggest gaps come at either end of the spectrum. That makes sense—these are the extremes, after all—but it suggests that the system doesn’t know exactly how to measure just how bad or good a team can be in this day and age. Four of the five teams in this week’s bottom five are playing at least 10 games under their projected finish. Detroit is the worst offender, currently on pace to go a staggering 49–113, or 19 games worse than FanGraphs’ already dismal 94-loss assumption. Presumably, they couldn’t imagine that the Tigers would roll out the worst offense in baseball night in and night out; at just 3.6 runs per game and with a collective OPS+ of 83, Detroit is basically one giant Austin Romine.
29. Orioles (41–87; Last Week: 29)
28. Marlins (45–81; Last Week: 27)
27. Royals (45–83; Last Week: 28)
26. Blue Jays (52–78; Last Week: 25)
25. Pirates (52–75; Last Week: 24)
A philosophical question: If you’re projected to be a last-place team, as the Pirates were by FanGraphs, and you end up there but are far worse than even that pessimistic prediction, how much do those extra losses really hurt? Pittsburgh is playing 10 games below FanGraphs’ 77–85 expectation thanks in large part to a horrific second half: 8–29. The big issue has been the pitching, with the Pirates allowing 6.2 runs per game since the All-Star break, as young arms like Mitch Keller and Joe Musgrove haven’t been up to snuff. That’s a worrying sign for the franchise’s future, particularly with the recent loss of Jameson Taillon to Tommy John surgery.
24. Mariners (54–74; Last Week: 26)
23. White Sox (58–69; Last Week: 23)
For all the excitement about Chicago’s flush farm system, FanGraphs wasn’t high on 2019 in the South Side, projecting the Sox to finish at 72–90. Lo and behold, they’re on pace for a 73–89 season, as the promise of those prospects has yet to deliver fully. Well, that’s not entirely true: Lucas Giolito has gone from having the league’s worst ERA in 2018 to a Cy Young contender, and Yoan Moncada (who’s currently on the IL) leads the team in OPS+ (134). The problem is that there’s been little else that’s gone right at the major league level in terms of development, and Chicago’s front office remains allergic to (or incapable of) adding help in free agency. Don’t be surprised if the White Sox are again pegged as a 90-loss team next season despite the prospect hype.
22. Rockies (58–70; Last Week: 22)
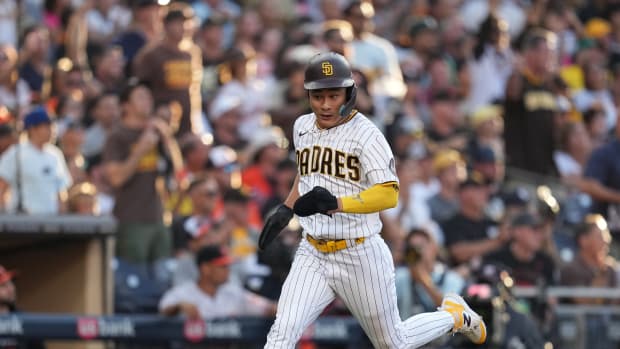
21. Padres (59–67; Last Week: 20)
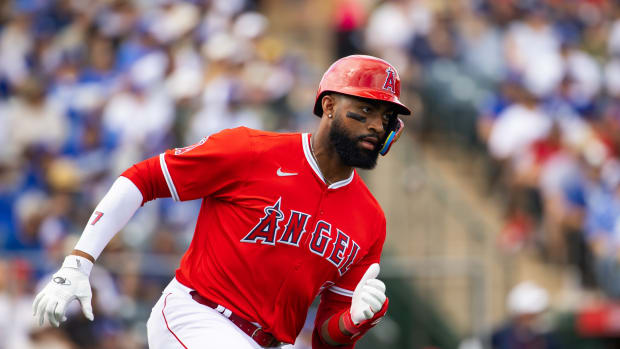
20. Angels (63–67; Last Week: 21)
19. Giants (63–65; Last Week: 19)
On the surface, this may look like an example of the computers getting it wrong: Expected to finish fifth in the NL West with 89 losses, the Giants are instead flirting with .500 and an unlikely playoff spot. But so much of this surprising season is built on a scalding July in which San Francisco went 19–6. Take that month out of the equation, and the Giants are 44–58, or a 70-win pace that’s right there with FanGraphs’ projection. San Francisco should still avoid last place, but another September skid like last year’s 5–21 disaster could land the team where the math said it would be.
18. Reds (60–66; Last Week: 17)
17. Rangers (63–66; Last Week: 18)
16. Diamondbacks (64–64; Last Week: 16)
15. Red Sox (68–61; Last Week: 11)
For the most part, FanGraphs underestimated its contenders; most are overperforming their predictions, some by quite a bit. And then there’s Boston, pegged for first place and a 96–66 campaign yet currently struggling to stay above .500. The main culprit: a pitching staff that’s already allowed more runs this year than it did all of last. That’s not going to get any better with Chris Sale on the shelf for the rest of the season, which is going to make that rosy preseason record impossible to reach.
14. Brewers (65–62; Last Week: 15)
13. Phillies (66–60; Last Week: 13)
12. Cardinals (68–58; Last Week: 12)
11. Mets (67–60; Last Week: 14)
For all the sturm und drang that surrounds the Mets (both this season and literally forever), and despite a dismal June that led into a brilliant second half, New York is on pace to finish 85–77. FanGraphs’ preseason prediction: 84–78. Accurately guessing the final stop for the runaway train that is the Mets might be both the most impressive bit of prognostication possible and the most perfect example of how water inevitably finds its level.
10. Rays (75–54; Last Week: 7)
9. Nationals (70–57; Last Week: 9)
8. Cubs (69–58; Last Week: 10)
Much hand-wringing and anger surrounded the Cubs in spring training, as they raged against the preseason projections—most notably Baseball Prospectus’ PECOTA—that had them finishing not just below .500, but also last in the NL Central. They even turned it into bulletin board material! FanGraphs was nicer to the North Siders, giving them first place and an 87–75 finish—which, with five weeks to go in the season, is what Chicago’s on pace to do. No word on whether BP will pin the Cubs’ final record to the wall this winter.
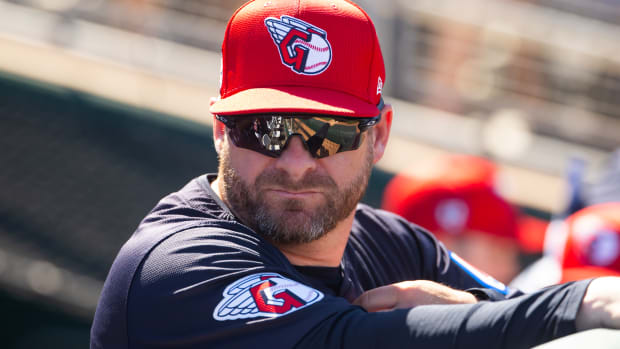
7. Indians (74–54; Last Week: 5)
6. A’s (74–53; Last Week: 8)
At a certain point, any projections for the A’s, no matter how positive, should add six-to-eight wins to the final total to reflect the fact that, invariably, they’ll surge in the second half. Oakland did it last year, winning 42 of its 65 games after the break, and it’s happening again in 2019, as the A’s are 23–12 since the All-Star Game, or a ridiculous 106–56 over a full season. That’s helped take Oakland from FanGraphs’ reasonable 85-win projection to a team on pace for 94 victories. Fool me once, shame on you. Fool me twice, you must be the A’s.
5. Twins (77–50; Last Week: 4)
Like the A’s, the Twins received cautious optimism from FanGraphs, which had them as a solid wild-card contender at 85–77 but nowhere near the first-place Indians in the AL Central. And like Oakland, Minnesota has eagerly blown past that assumption, trending toward 98 wins and fighting hard to keep Cleveland from a fourth straight division title. A power explosion has helped the Twins become one of baseball’s best teams: They have 11 players with double-digit home runs this season and a league-leading six with 20 or more. The rabbit ball is likely wreaking havoc on offseason expectations, with Minnesota as the prime example of its results.
4. Braves (77–52; Last Week: 6)
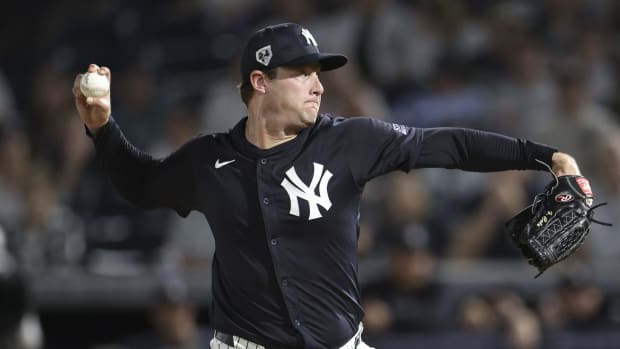
3. Yankees (83–46; Last Week: 3)
2. Astros (82–47; Last Week: 2)
1. Dodgers (85–44; Last Week: 1)
As noted earlier, the ends of the spectrum gave the projection systems the most trouble. As with the Tigers, the Dodgers left their preseason record (92–70) in the dust: They’re on pace to win 106 games and run away with a seventh straight NL West crown. Cody Bellinger’s transformation into a titan has helped boost Los Angeles’ record in a big way, but just as key is that, in the lineup as a whole, there are no weak spots. The Dodgers give almost no at-bats to below-average hitters; it should be no surprise, then, that they lead the NL in runs per game, homers, on-base percentage, slugging percentage and OPS+. That’s one way to turn a good team into an all-time great one.